ParaView Tutorial
A beginner-friendly tutorial on using ParaView for scientific visualization
Data Visualization
Data visualization is an essential tool for scientists and engineers to explore and communicate complex data. Visualization allows us to gain insights into our data, identify patterns, and communicate our findings effectively. ParaView is a powerful scientific visualization tool that enables users to visualize and analyze large datasets in 2D and 3D. It supports a wide range of data formats and provides a variety of visualization and analysis tools. Examples of data that can be visualized in ParaView include computational fluid dynamics simulations, geospatial data, medical imaging data, and more.
In this tutorial, we’ll cover the basics of using ParaView for scientific visualization. We’ll explore how to load data, visualize data in 2D and 3D, apply filters for data analysis, and export visualizations for publication.
What is ParaView?
ParaView is an open-source, multi-platform data analysis and visualization application. It is designed to handle large datasets and provides a range of visualization and analysis tools for scientific and engineering applications. ParaView supports a variety of data formats, including structured and unstructured grids, point clouds, and images.

Getting Started with ParaView
To get started with ParaView, you can download the latest version of the software from the ParaView website. ParaView is available for Windows, macOS, and Linux operating systems. Once you have downloaded and installed ParaView, you can launch the application and start exploring its features.
Loading Data
ParaView supports a wide range of data formats, including VTK, XML, CSV, and more. To load data into ParaView, follow these steps:
- Launch ParaView.
- Click on the “Open” button in the toolbar.
- Browse to the location of your data file and select it.
- Click “OK” to load the data.
Visualizing Data
Once you have loaded data into ParaView, you can visualize it in 2D and 3D. ParaView provides a variety of visualization options, including contour plots, volume rendering, and streamlines. To visualize data in ParaView, follow these steps:
- Select the data you want to visualize in the Pipeline Browser.
- Click on the “Apply” button in the toolbar to apply the default visualization.
- Use the Display panel to customize the visualization, such as changing the color map, opacity, and lighting.
Filters and Data Analysis
ParaView provides a range of filters for data analysis and manipulation. Filters allow you to extract information from your data, apply transformations, and perform calculations.
To apply a filter in ParaView, follow these steps:
- Select the data you want to filter in the Pipeline Browser.
- Click on the “Filters” menu and select the desired filter.
- Configure the filter parameters in the Properties panel.
- Click “Apply” to apply the filter to the data.
Favorite Filters
Some of my favorite filters in ParaView include:
- Contour: Useful for visualizing isocontours of scalar data.
- Clip: Great for cutting away parts of the dataset to reveal internal structures.
- Slice: Useful for extracting 2D slices from 3D datasets.
- Threshold: Handy for filtering data based on scalar values.
- Stream Tracer: Useful for visualizing flow fields and streamlines.
- Glyph: Great for visualizing vector fields with glyphs.
- Warp by Scalar: Useful for deforming the dataset based on scalar values. This is great for visualizing deformation fields.
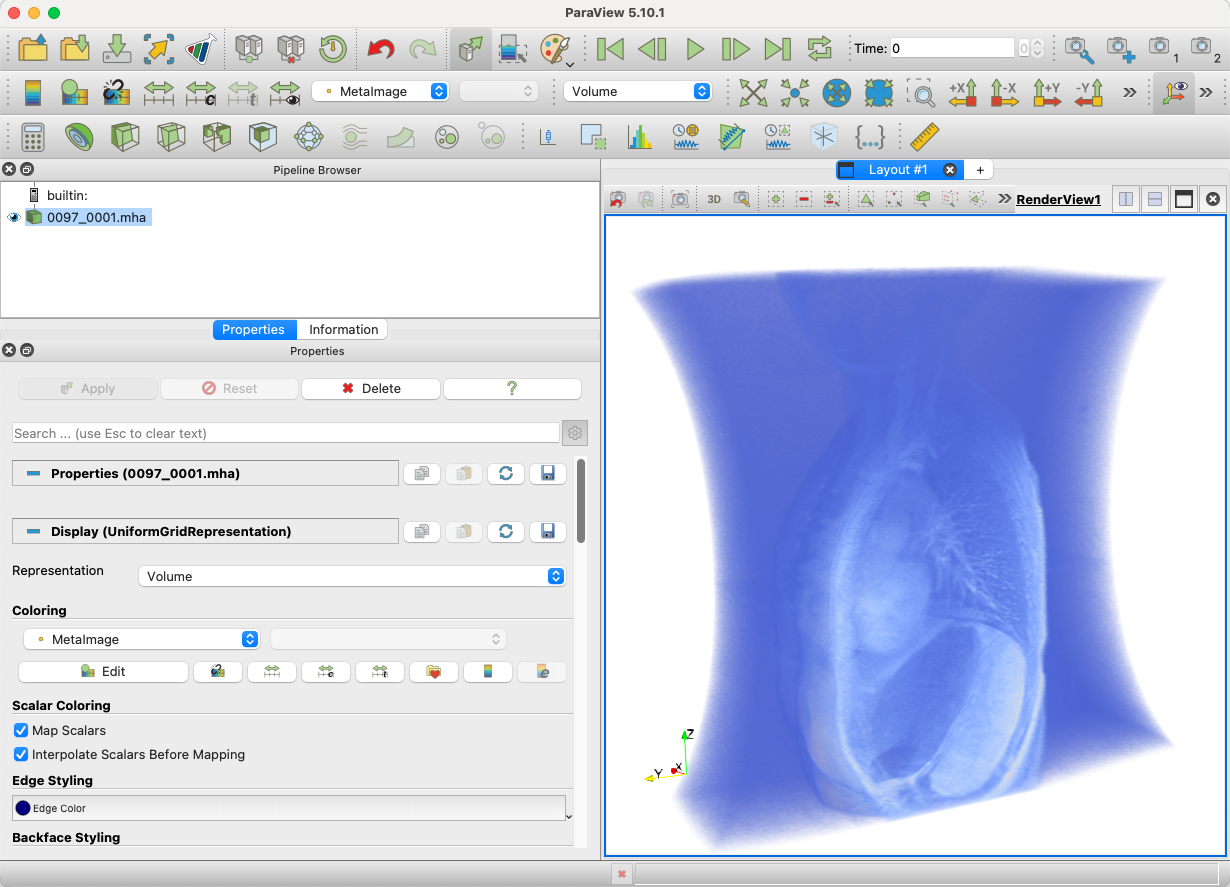
Visualizing 3D Medical Image Data
ParaView is a powerful tool for visualizing 3D medical image data, such as MRI and CT scans. It provides a range of tools for volume rendering, segmentation, and surface extraction. To visualize 3D medical image data in ParaView, follow these steps:
- Load the medical image data into ParaView.
- Apply a volume rendering filter to visualize the data in 3D.
- Choose isosurface as blend mode and adjust the opacity and color map.
- Use the segmentation tools to extract regions of interest.
- Apply surface extraction filters to create 3D surface meshes.
Saving and Exporting Data
Once you have created a visualization in ParaView, you can save it in a variety of formats for publication and sharing. ParaView supports a range of file formats, including images, videos, and 3D models.
To save a visualization in ParaView, follow these steps:
- Click on the “File” menu and select “Save Screenshot” to save an image of the visualization.
- Click on the “File” menu and select “Save Animation” to save a video of the visualization.
- Click on the “File” menu and select “Export Scene” to save the visualization as a ParaView state file.
Conclusion
ParaView is a powerful scientific visualization tool that enables users to explore and analyze complex datasets in 2D and 3D. In this tutorial, we covered the basics of using ParaView for data visualization, including loading data, visualizing data, applying filters, and exporting visualizations. ParaView is a versatile tool that is widely used in scientific research, engineering, and data analysis. I hope this tutorial has provided you with a solid foundation for using ParaView in your own work. Happy visualizing!
Enjoy Reading This Article?
Here are some more articles you might like to read next: